

Discover how data shapes the world around us
Data Analytics involves examining raw data to extract meaningful insights that can guide decision-making and strategy. It is a blend of science, technology, and business knowledge, enabling organizations to understand patterns, predict trends, and solve problems with data as the key resource.
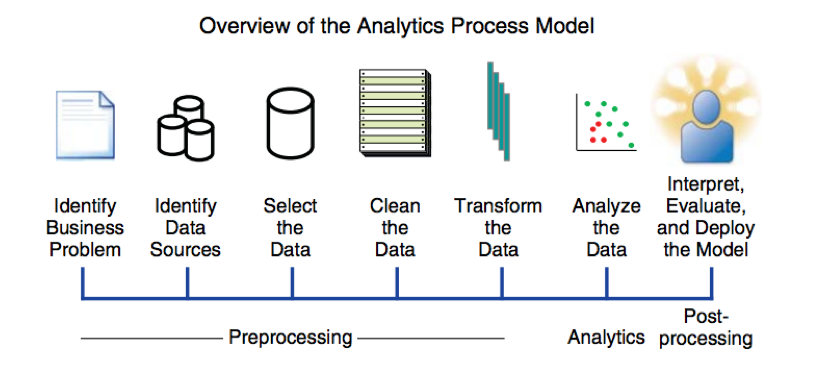
Data Analytics is crucial for staying competitive in a world driven by data. Whether it’s understanding customer preferences or improving operational efficiency, analytics provides the insights needed for informed decisions. Key benefits include:
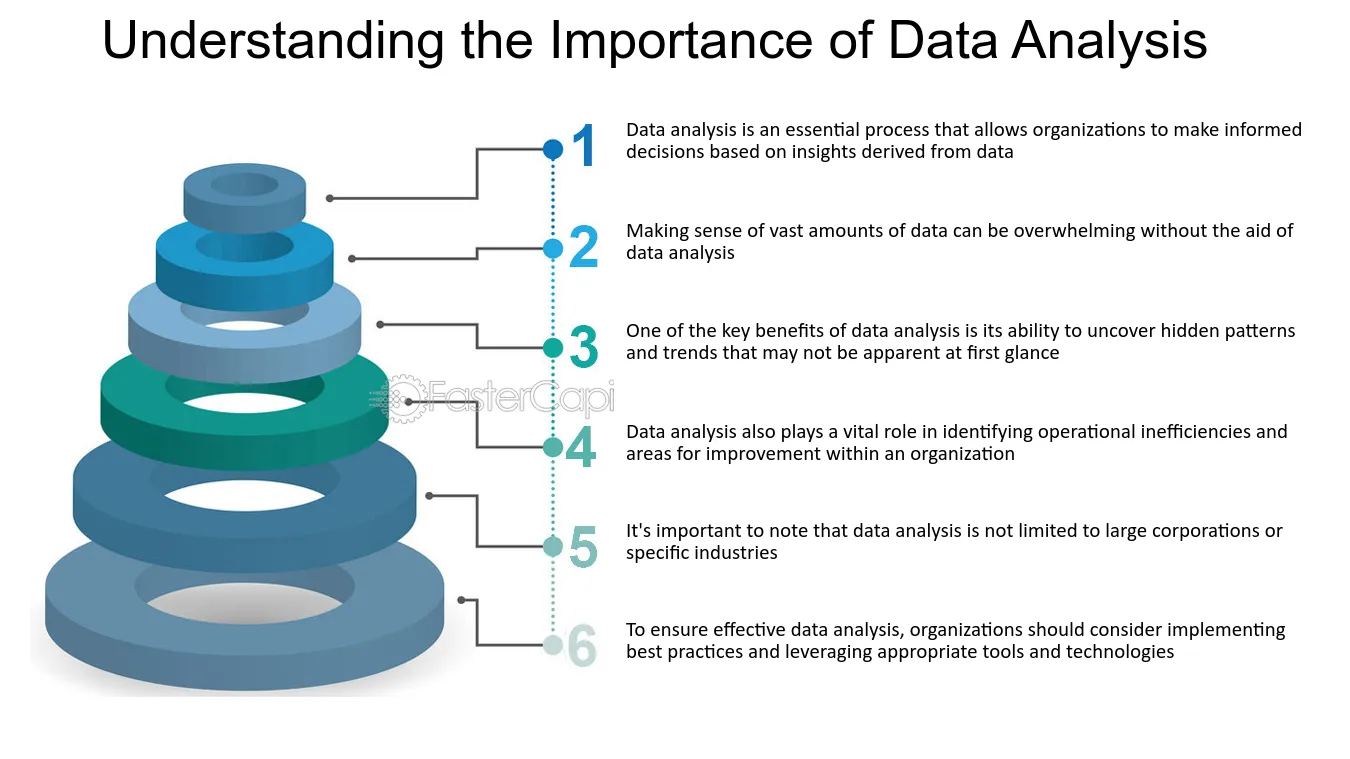
Data Analytics is transforming how industries operate, unlocking new possibilities and efficiencies. Some notable applications include:
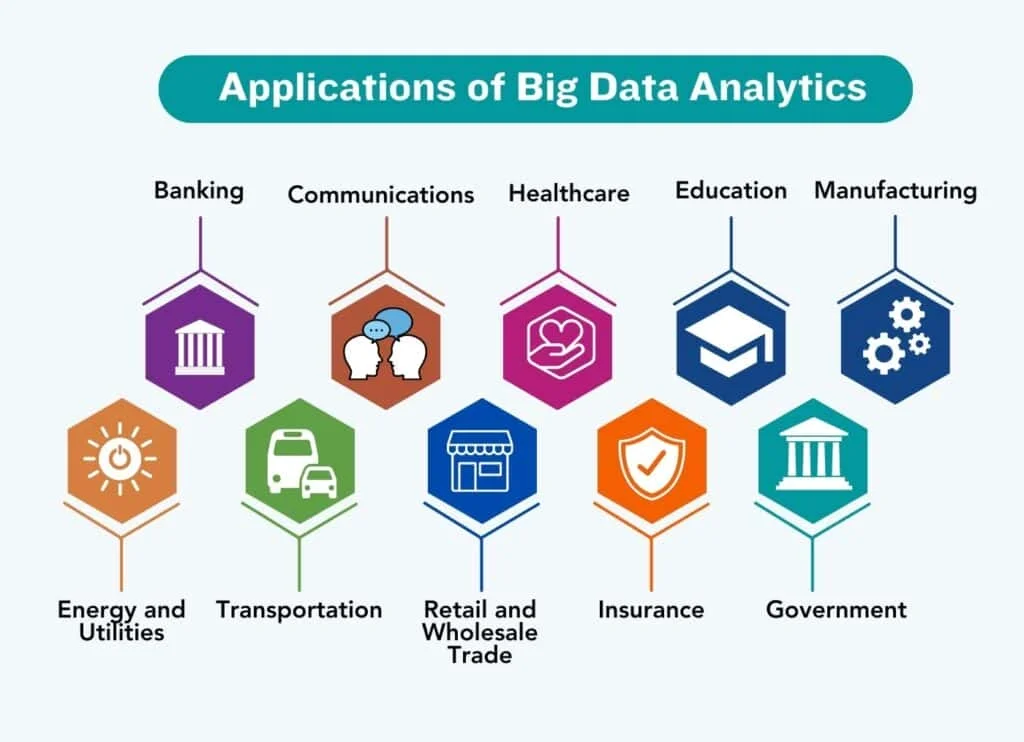
This step involves gathering data from various sources, such as databases, surveys, and web scraping. Ensuring the quality and relevance of data is critical to the success of any analysis.
Cleaning ensures data is accurate and ready for analysis. This includes handling missing values, removing duplicates, and correcting errors.
This involves applying statistical methods, visualization techniques, and algorithms to uncover insights. Tools like Excel, Tableau, and Python libraries (e.g., Pandas, Matplotlib) are popular for this stage.
The final step is presenting findings in an understandable and actionable format. Dashboards, charts, and reports help stakeholders make data-driven decisions.
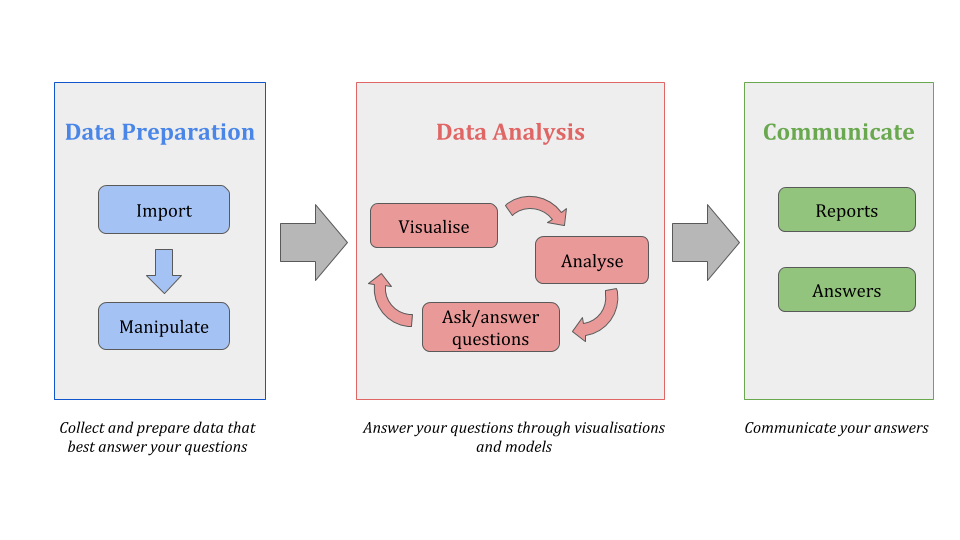
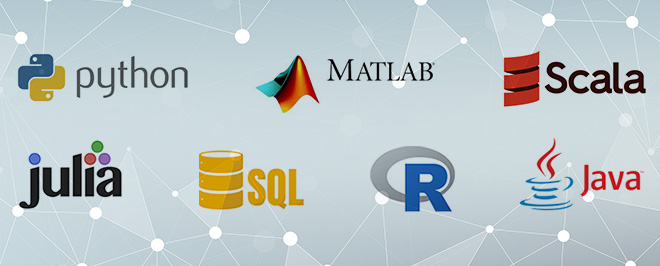
Data Analytics involves the use of various programming languages to manipulate, process, and analyze data. Some of the most popular ones are:
Learning Data Analytics requires a combination of theoretical understanding and practical experience. Here are some excellent resources:
By following these resources and practicing regularly, you can master Data Analytics and open doors to exciting career opportunities.
Learn how Python's libraries like Pandas, NumPy, and Matplotlib play a crucial role in data analytics workflows.
Learn how SQL can be a powerful tool for data analytics, helping you extract valuable insights from large databases.
Explore the key differences between Power BI and Tableau, their unique features, and practical use cases to help you choose the best tool for creating impactful and insightful data visualizations tailored to your needs.
Explore the end-to-end process of data analytics, from data collection to insight generation using Python and SQL to empower your analytics workflow.
Discover how to use Python to tackle advanced data analytics tasks through case studies using real-world datasets to gain deeper insights.